FBCNet: A Multi-view Convolutional Neural Network for Brain-Computer Interface (2021)
Open in webOpen in zoteroOpen pdf
1 Abstract
Lack of adequate training samples and noisy high-dimensional features are key challenges faced by Motor Imagery (MI) decoding algorithms for electroencephalogram (EEG) based Brain-Computer Interface (BCI). To address these challenges, inspired from neuro-physiological signatures of MI, this paper proposes a novel Filter-Bank Convolutional Network (FBCNet) for MI classification. FBCNet employs a multi-view data representation followed by spatial filtering to extract spectro-spatially discriminative features. This multistage approach enables efficient training of the network even when limited training data is available. More significantly, in FBCNet, we propose a novel Variance layer that effectively aggregates the EEG time-domain information. With this design, we compare FBCNet with state-of-the-art (SOTA) BCI algorithm on four MI datasets: The BCI competition IV dataset 2a (BCIC-IV-2a), the OpenBMI dataset, and two large datasets from chronic stroke patients. The results show that, by achieving 76.20% 4-class classification accuracy, FBCNet sets a new SOTA for BCIC-IV-2a dataset. On the other three datasets, FBCNet yields up to 8% higher binary classification accuracies. Additionally, using explainable AI techniques we present one of the first reports about the differences in discriminative EEG features between healthy subjects and stroke patients. Also, the FBCNet source code is available at https://github.com/ravikiran-mane/FBCNet.
2 NOTES
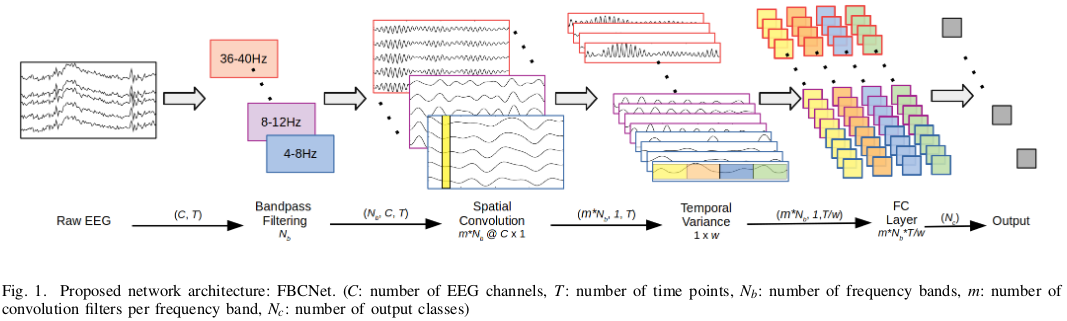
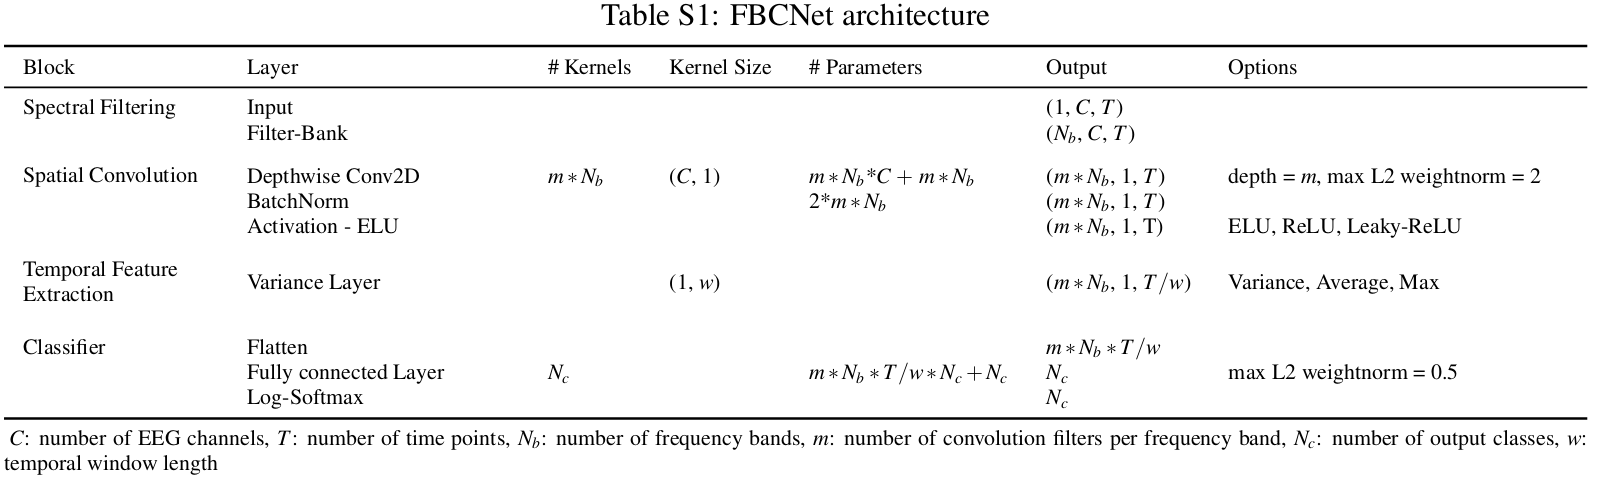
The proposed architecture of the network is quite similar to that of Shallow ConvNet, but instead of using a temporal convolution as a band-pass of sorts they use a filter-bank (9 distinct bands). Also, after the spatial convolution they proposed the of a variance instead of mean pooling, which they prove from comparisons that result in better accuracy.
Quotes:
Quote
[…] considering that various classes of MI differ in their spectral power (ERD/ERS), a variance operation, which represents the spectral power in the given time series becomes a more suitable option [when compared to max and mean pooling] for EEG temporal characterization. Therefore, for effective extraction of temporally discriminative information, we propose a novel Variance layer that characterizes a time series by computing its variance. (pg. 3)
Quote
Therefore, the Variance layer provides more importance to the signal points which are away from the mean by assigning a higher proportion of the incoming gradient to these points. This also aligns with the characteristics of EEG wherein the deviation from the mean, in a form of ERD or ERS is a distinct signature of MI. (pg. 4)
Quote
The CV analysis was conducted in a 10 fold setting, with the 9 folds being used for training and 1 fold for testing. The folds were constructed by a sequential, class-balanced allocation of trials and this allocation was maintained constant for the entire analysis. […] In HO analysis, the complete data from session 1 for the given subject was used for the training purpose, and the resulting model was tested on the session 2 data. (pg. 4)
Quote
In the BCI field, a system with >70% 2-class classification accuracy is generally considered to be usable by healthy subjects and stroke patients [32]. (pg. 6)
[32] X. Shu, S. Chen et al., “Fast recognition of BCI-inefficient users using physiological features from EEG signals: A screening study of stroke patients,” Front. Neurosci., vol. 12, p. 93, 2018.
Quote
For healthy subjects, the 12-16Hz and 8-12Hz were observed to be the two most relevant frequency bands and they constituted 34% of the total input relevance averaged across all subjects. Also, the channel relevance in these two frequency bands was most concentrated at the left and right motor areas of the brain (C3, C4). All these characteristics were closely associated with the known MI signatures. In stroke patients, the averaged relevance patterns were observed to be more diffused and all the frequency bands in the 4-24Hz range resulted in similar input relevance. Moreover, the channel relevance patterns in these frequency bands were also much more diffused and many channels received similar total relevance scores. Yet, the C4, CP4 and, P4 channels in the 8-12Hz range, C3, C4, and CP4 channels in the 12-16Hz range, and F7 and F8 channels in the 4-8Hz range, were observed to have slightly higher relevance than other channels. (pg. 8)
Quote
From the heatmap, as well as the normalized histogram, the 12-16Hz was observed to be the frequency band with the highest relevance in half of the healthy subjects. Contrarily, for stroke patients, no single highly relevant frequency band could be identified, and the most relevant frequency band was highly subject-specific. Moreover, for each stroke patient, the input relevance was distributed across multiple frequency bands, and the difference in the relevance of the first and the second most relevant frequency band was quite low. Furthermore, this difference was significantly different from healthy subjects’ data. (pg. 8)
Quote
We observed that by encapsulating the true signatures of MI, these features also generalized well on the unseen test data which explained the higher classification accuracies achieved by FBCNet.